
Your earnings scorecard, built from your coverage list
Q3 earnings season is wrapping up, and every name that reported leaves you with the same question: was that move the stock, or the market? The answer decides whether you go back to your view or leave it alone. Getting it usually means pulling prices, matching print dates and splitting each move by hand, one name at a time.
Kelly, Omega Point's AI agent for investment intelligence, can build that scorecard for your whole coverage list in minutes. Hand it the names you cover and you get one scorecard for the season.
What the scorecard shows
For each name on your list that reported, you get three things:
- The earnings-day reaction, meaning how the stock moved on the print.
- What you made over the next 7 days, so you see the whole reaction and not only day one.
- How much of that was the stock itself, as opposed to the market, its sector or a theme moving around it.
Why the split matters
Two names can fall by the same amount after a print and mean very different things. If most of one move was the market, the print may have told you little. If most of the other was stock-specific, the company may be telling you something. The scorecard separates the two, so you know where to spend your time.
How it works
For each name that reported, Kelly uses Omega Point's risk models to separate the move into what the broad drivers explain and what belongs to the stock alone. It does this over the same window for every name, so the numbers line up across your list. Nothing is guessed: the splits are calculated, and if you want to know where a figure came from, you can ask and Kelly will show you.
You ask the way you already would: here is my coverage list, how did this reporting season go, was it me or the tape. There is no template to build, and next quarter you ask again on the new set of names.
How to run it in Kelly
- Give Kelly your coverage list. Paste your tickers into the chat, or use the list we loaded when we created your account.
- Ask in plain language. For example: "Here is my coverage list. For every name that reported this quarter, show me the earnings-day reaction, what I made over the next 7 days, and how much of the move was the stock itself versus the market, its sector and themes."
- Read the scorecard. You get one row per name, with the same window and the same split for each, so you can compare across the list.
- Follow up on the names that matter. Ask which moves were mostly the stock, which were mostly the market, or where a figure came from, and Kelly shows its work.
- Come back next quarter and ask again on the new set of names.
What you need to get started
Just a list of tickers. No portfolio upload and no setup first. We load your coverage list when we create your Kelly account, and the scorecard can run from there.
Want to see it on your own names? Book 15 minutes here to get setup with your own Kelly account.
What Forces Are Impacting Your Performance? Find Out Now...
More Related Insights

AI Suppliers fell as much from 2 to 6 Nov as in all of October, through a midterm upset, an AI-chip rout and an oil slump. AI Adopters lost far less.

Kelly runs your daily risk checks, movers alerts and P&L explanations on schedule, built the same way every time, so you see the risk before it costs you.
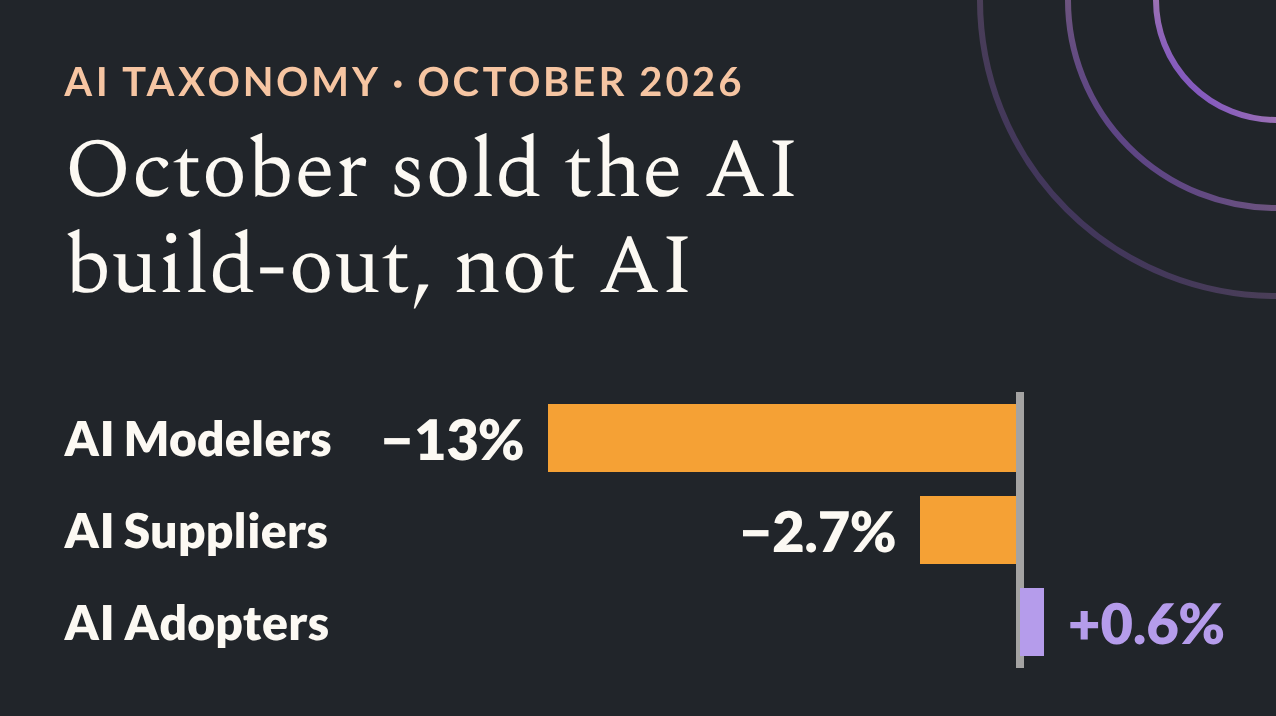
Omega Point’s AI Taxonomy shows AI Modelers fell 13% and Suppliers 2.7% in October while Adopters rose 0.6%. See which AI exposures drove returns.