
Five days of November did October's damage to AI's builders

November opened with three shocks in four days. Democrats swept the US midterms on 3 Nov. On 4 Nov the Dow had its best day since April 2025 and oil fell about 10% on hopes of peace with Iran. On 5 Nov the Nasdaq fell 5.5% as investors dumped AI chip stocks, fearing tighter rules for data centers. Chips bounced on Friday.
Through the Omega Point AI Taxonomy, the week ran October's pattern at speed: companies that supply AI fell −3.0%, companies that adopt it −1.1%, ACWI −2.4%. Over the whole of October, which our October article covered to the 23rd, both fell too, Suppliers by more.
The Omega Point AI Taxonomy, designed by Omega Point with language-analysis technology from our partner Noonum, asks not whether a company is exposed to AI, but how: by its role, and by the kind of link, inside each industry. November uses the baskets as refreshed at the end of October.
How the taxonomy sorts companies
The taxonomy has three Categories. Suppliers and Adopters each have four Sub-Categories, crossed with the GICS industries, so every pairing of an industry and an AI role is its own basket: 544 in all, 461 of them populated in November. Membership is read from what companies, the press and analysts say about each name.

Company names are examples of basket membership, not investment recommendations.

Builders down hard, users down less
Suppliers trailed all three benchmarks (ACWI −2.4%, SPY −2.7%, all covered stocks −2.7%); Adopters beat all three. Breadth tilted the same way: 37% of Supplier baskets rose, against 50% of Adopter baskets.
The Modeler basket slipped −0.6% after a −21.9% October. Its biggest weights pulled in opposite directions: Z.AI fell 12% and MiniMax 3%, while Alibaba rose 12% and Baidu 7%.

October's direction mostly held. Both Categories fell again, Suppliers by more, and the Supplier – Sub-Categories kept October's top two, Data & Models then Chips & Compute; Power & Energy and Cloud & Infra, the weakest pair in October, stayed at the bottom but swapped places. Basket by basket, October's returns carried into November (correlation 0.5). Among Adopters, Marketing Operations went from last to first.

The industry view: technology and energy, in both roles
Two sectors did most of the damage, in both rings. IT Suppliers fell −11.4% and IT Adopters −11.2%; Energy Suppliers fell −10.5% and Energy Adopters −9.2%. Inside IT, hardware and chips fell hardest: Technology Hardware Suppliers −13.8% and Semiconductor Suppliers −14.5%, against −6.0% for software and services.
Energy reversed October, when its Supplier basket rose +4.7%; Brent fell 15% or more over the week. Industrials Suppliers fell −5.7%, Capital Goods −8.0%.
October's rule still reads the rings. Where both roles fell together, as in IT and Energy, the loss belonged to the industry. Where they split, it belonged to the role: Communication Services Adopters rose +4.0%, led by Media & Entertainment (+5.3%), after −5.9% in October, while Suppliers were flat (0.0%), dragged by telecom (−4.5%).

Adopters beat Suppliers in ten of eleven sectors, up from seven in October; the exception, Consumer Staples, went to Suppliers by a tenth of a point.
The Sub-Category view: data held, power fell again
Where in the market did the moves sit? The industry rings answer that. Which link in the AI chain carried them? A rollup by Sub-Category answers this.
All four Supplier – Sub-Categories fell. Data & Models was the steadiest at −0.5% and rose in eight of eleven sectors; its losses sat in IT (−11.5%) and Energy (−10.4%). Chips & Compute (−3.4%) and Cloud & Infra (−4.0%) followed. Power & Energy was the weakest (−4.5%, after −5.2% in October, when only Cloud & Infra did worse) and fell in all eleven sectors.

The Adopter – Sub-Categories split, from +1.1% for Marketing Operations to −1.2% for Product Quality, a 2.3-point spread against 4.0-point for Suppliers. All fell in IT, and all with an Energy basket fell there: Adopters moved with their industry.
| In November as in October, the input decided Suppliers and the industry decided Adopters. What changed was the pace.
What this means for your book
October's lesson held, faster: a book long AI Suppliers lost in five days what October took a month to take.
- Attribution. Separate the industry from the role. The IT and Energy losses hit both roles; the role gap shows in the other nine sectors.
- Hedging. Long Adopters, short Suppliers earned again, after giving some back in late October. Size it as a risk, not a trend.
- Risk. Policy is now an AI risk: an election moved data-center and chip stocks within two days, and a single AI factor would hide which roles it hit.
To run your own portfolio through the taxonomy, use its Omega Point content sets or Omega Point's MCP connector for Claude.
Methodology
How membership is decided. Each basket ("strategy") has a written investment objective, such as aerospace makers that use AI to inspect welds. Using Noonum's technology, Omega Point reads what companies, the press and analysts say about every stock and scores how closely that language matches each objective. A stock joins a basket when its language signal (its conviction score) for that basket is strong enough to qualify. Its weight in the basket is the strength of that signal (its linguistic beta).
- Baskets. The current version of the taxonomy has 544 baskets. Members are fixed as of 30 Oct 2026, the last trading day before November, in Omega Point's global equity universe. 461 baskets had members with returns, covering 4,143 stocks.
- Refresh. The taxonomy's memberships were refreshed between 23 and 30 Oct: 11,965 memberships, down from 13,802, of which 75% were already in place before. The 30 Oct membership is also the latest available; it was unchanged on 6 Nov.
- Basket return. The buy-and-hold total return of the members from 2 to 6 Nov 2026 (held without rebalancing), weighted by linguistic beta.
- Industry rollup. Baskets in the same GICS industry group are averaged with equal weights into an industry-group basket. Industry groups are averaged into sector baskets, and sectors into one AI basket per Category. GICS follows the 2023 structure; REIT industries roll up to Equity REITs.
- Sub-Category rollup. Baskets in the same Sub-Category are averaged with equal weights, and the Sub-Categories into one AI basket per Category.
- Separate Categories. Suppliers and Adopters are rolled up separately. AI Modelers form a single basket (15 companies).
- One listing per company. Each company counts once in each basket: where it has several listings (depositary receipts, secondary or dual-class lines), only its largest by market cap is kept. This applies to November and to the October comparison.
- October comparison. October figures cover the full month, 1 to 30 Oct 2026, with members fixed as of 30 Sep 2026 as in the October article, which covered 1 to 23 Oct.
Robustness. The conclusions hold under two alternatives (industry rollup, Suppliers / Adopters): equal-weighting members inside each basket gives −2.8% / −0.6%; dropping baskets with fewer than 10 names gives −2.9% / −2.2%. Basket names describe language-based exposure and are not investment recommendations.
What Forces Are Impacting Your Performance? Find Out Now...
More Related Insights

Kelly runs your daily risk checks, movers alerts and P&L explanations on schedule, built the same way every time, so you see the risk before it costs you.
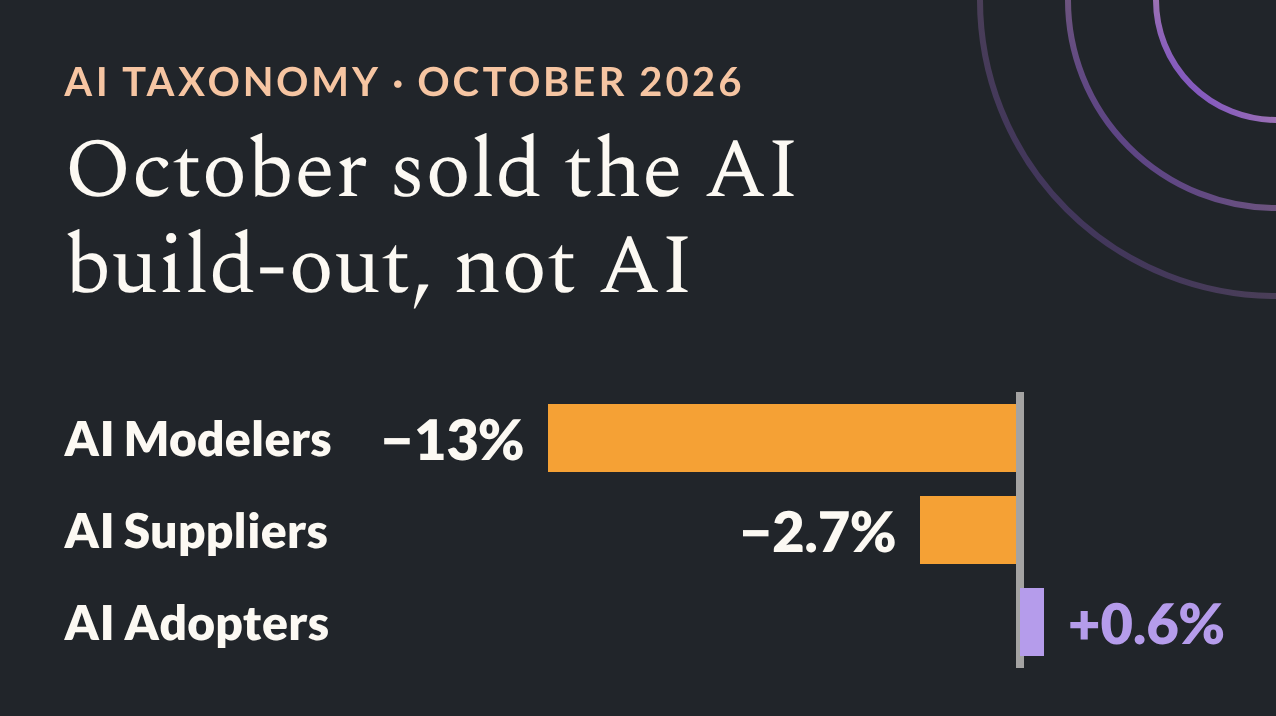
Omega Point’s AI Taxonomy shows AI Modelers fell 13% and Suppliers 2.7% in October while Adopters rose 0.6%. See which AI exposures drove returns.

Explore the networking and optical technologies linking AI chips and data centers, and the global companies positioned to benefit from rising bandwidth demand.