
October sold the AI build-out, not AI
Companies that build AI fell hard this month, while companies that use it held their ground.
Month to date, 1 to 23 Oct 2026, through the Omega Point AI Taxonomy. 1 to 23 Oct 2026 | Total returns, USD | Data: Omega Point
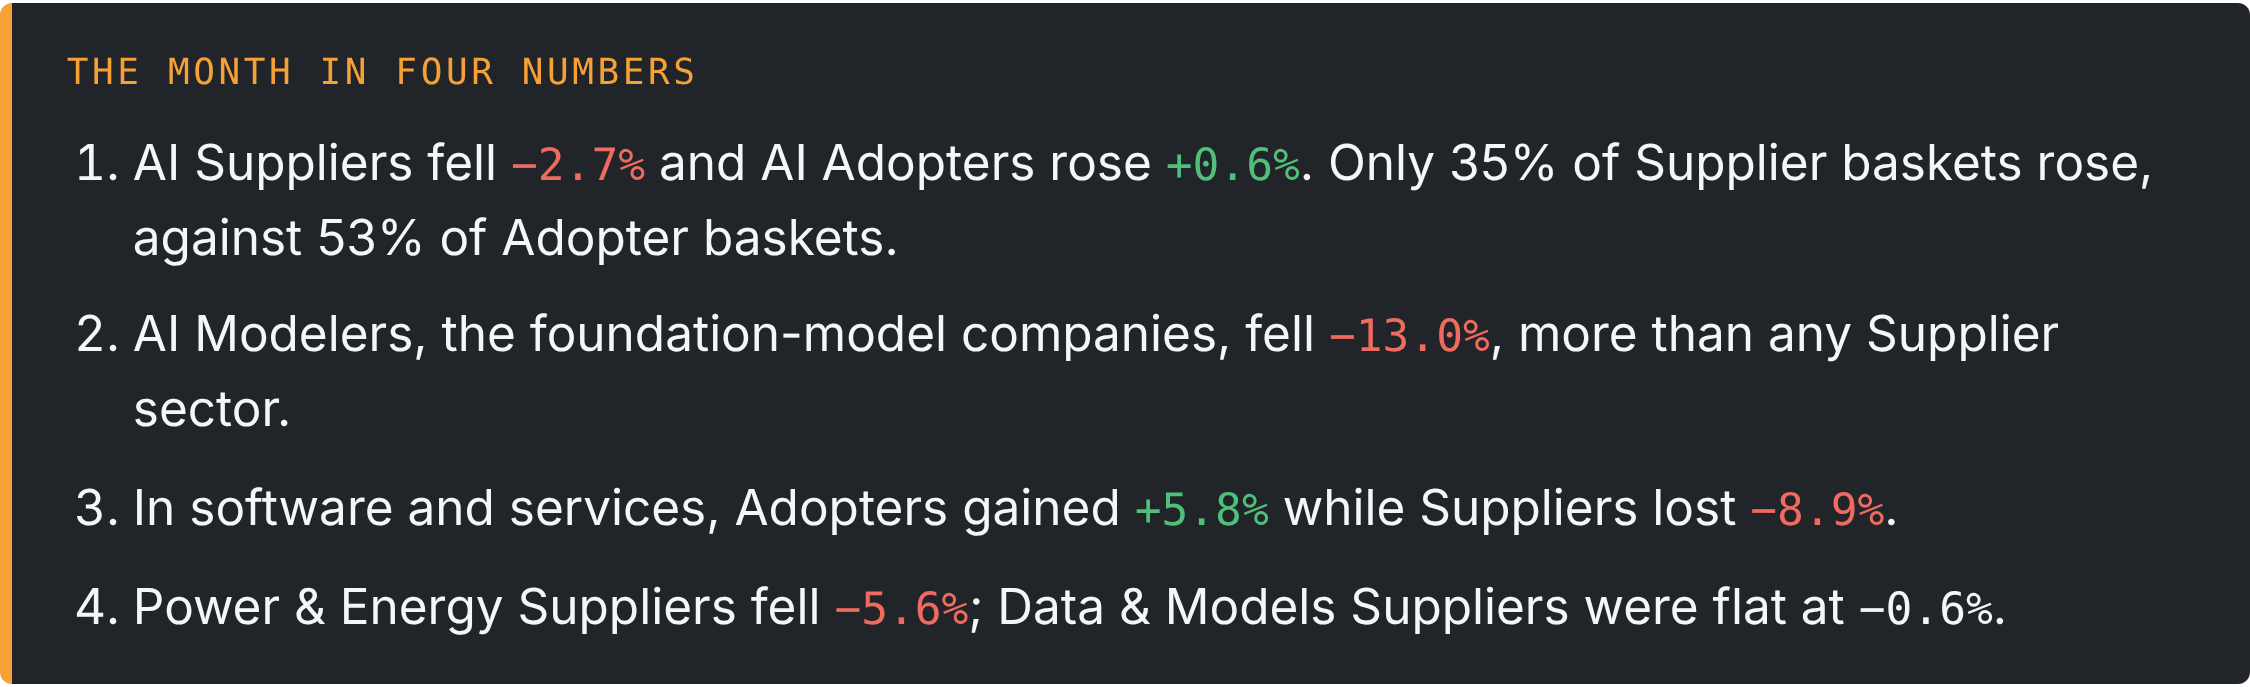
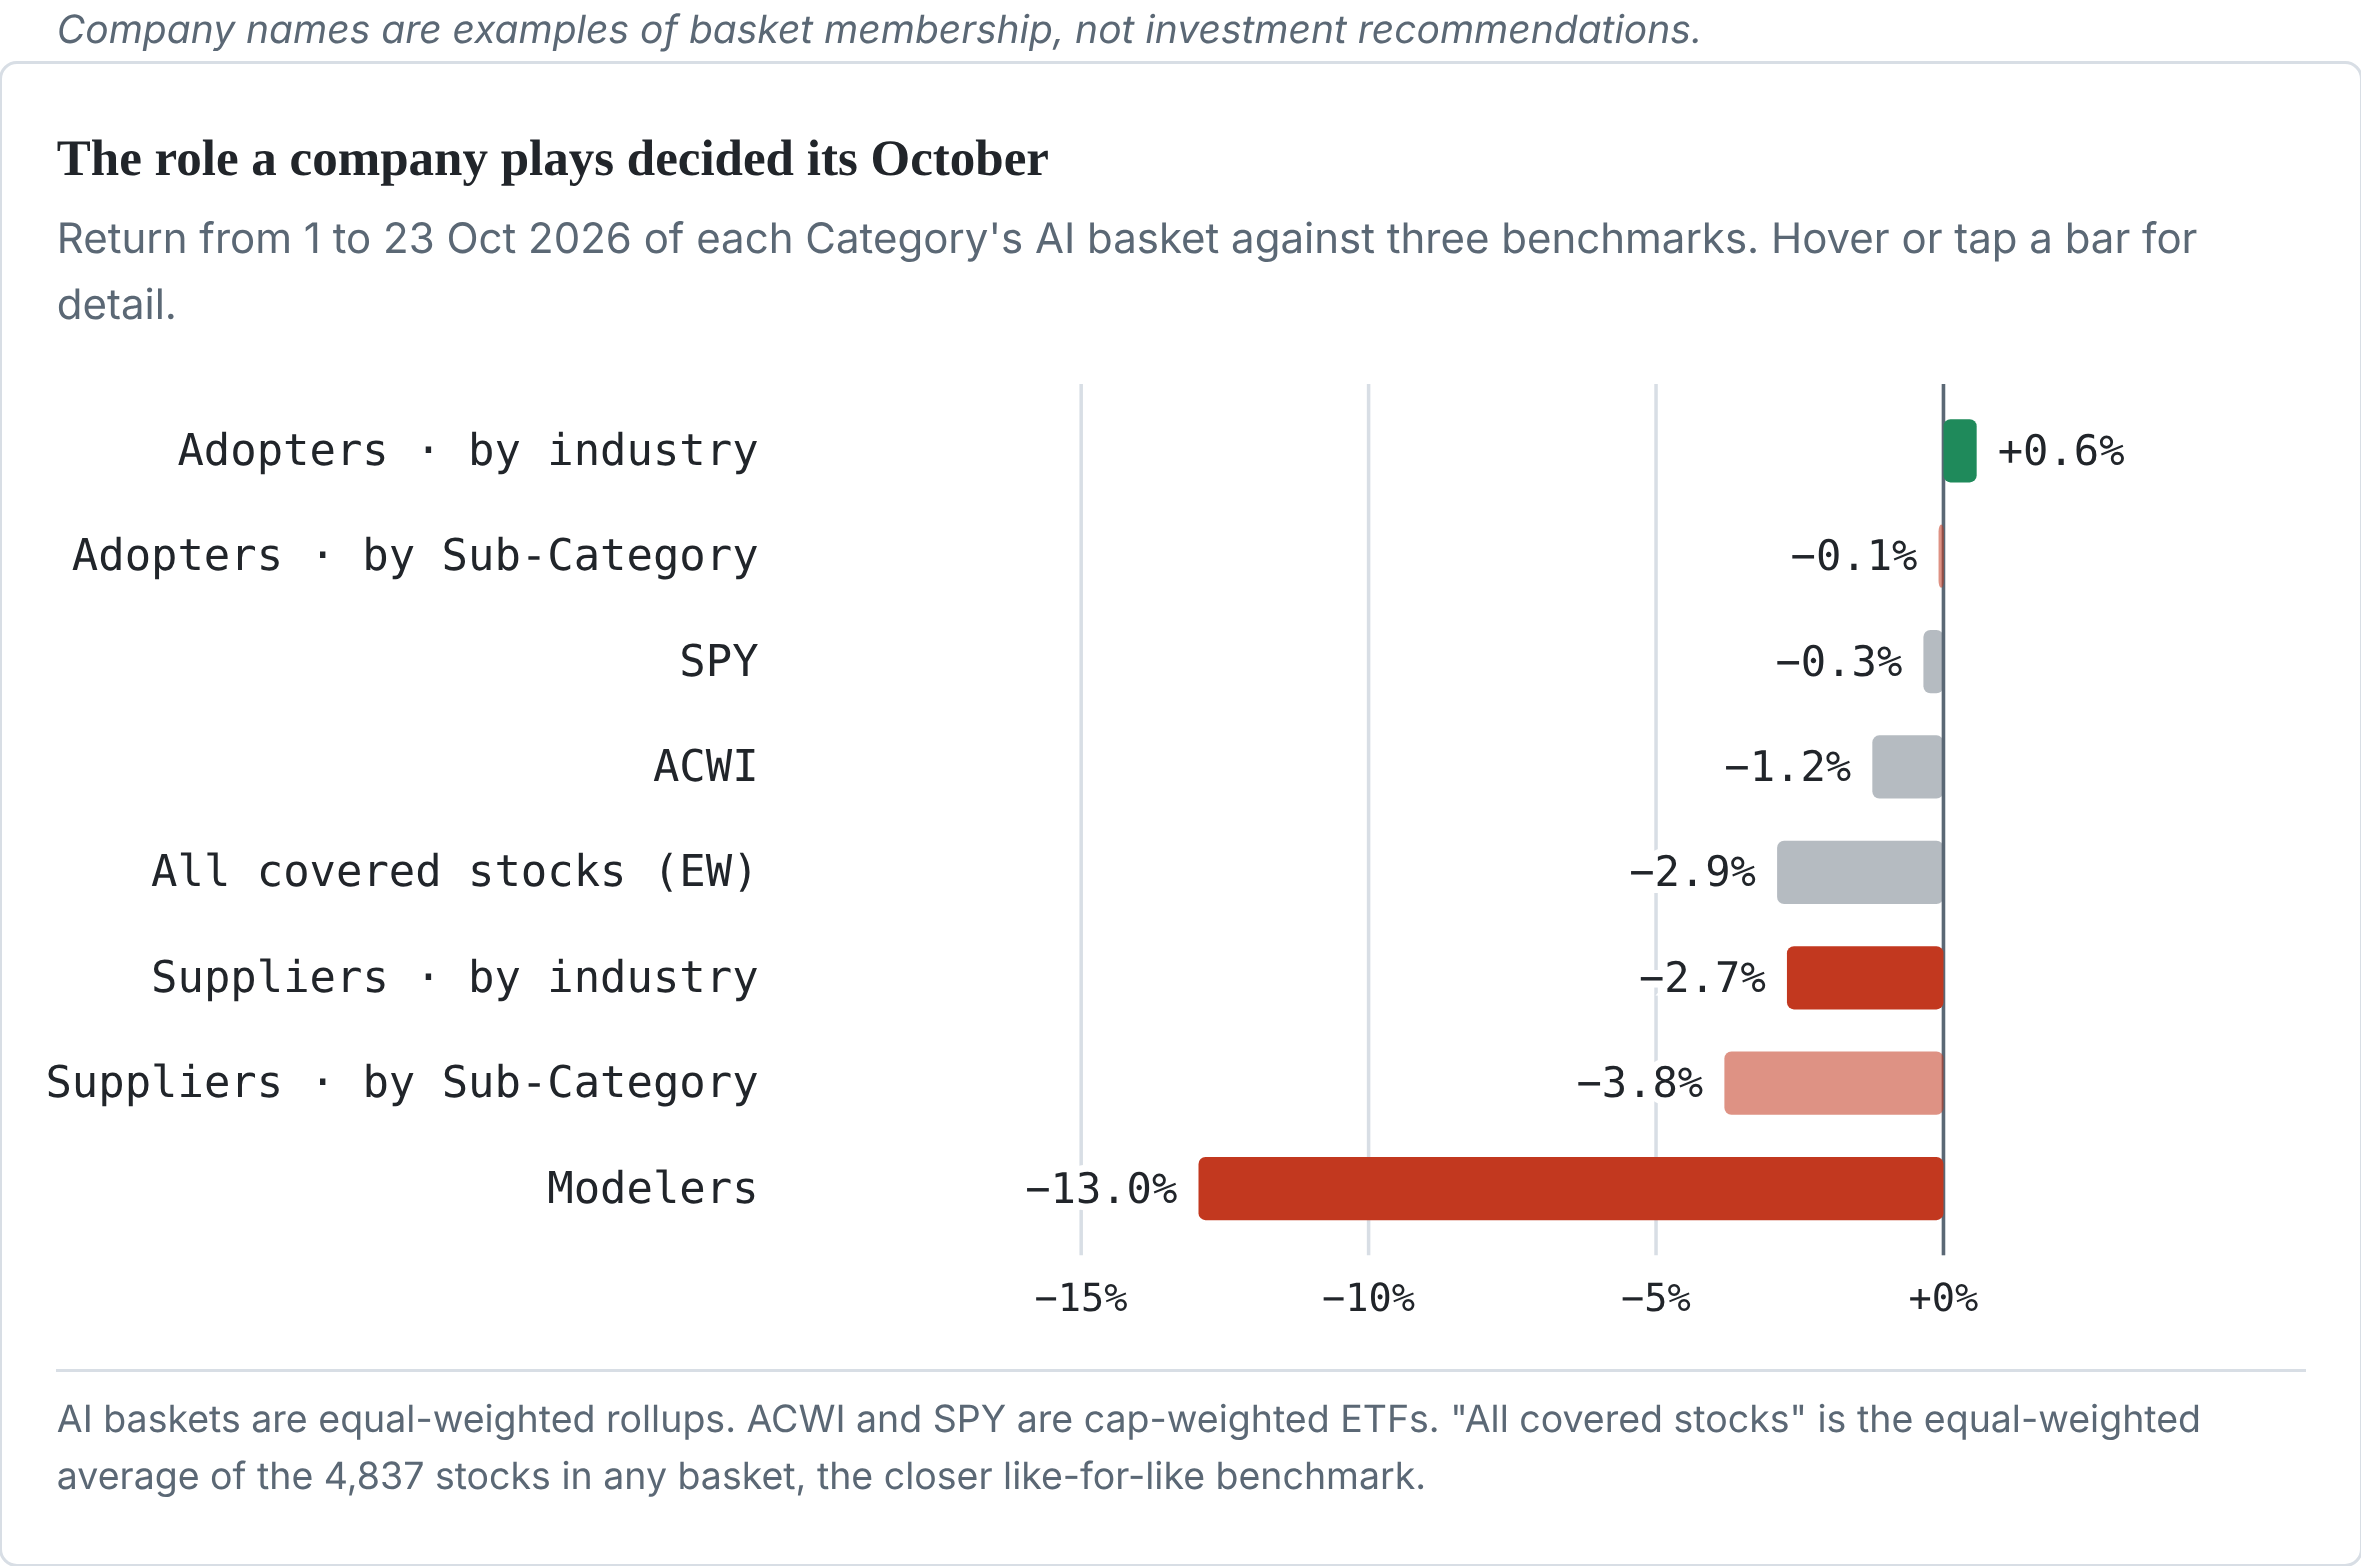
AI was not one trade in October. From 1 to 23 Oct, companies that supply AI fell −2.7%, companies that adopt it rose +0.6%, and foundation-model builders fell −13.0%. ACWI fell −1.2%.
A single AI exposure score, or an AI ETF, would have read the month as a broad AI selloff. An "AI" label on a book hid two opposite bets.
The Omega Point AI Taxonomy tells those bets apart. Omega Point designed the taxonomy, and it runs on language-analysis technology from our partner Noonum. Rather than scoring whether a company is exposed to AI, it sorts companies by the role they play and the kind of link they have to AI, within each industry.”
How the taxonomy sorts companies
The taxonomy has three Categories. Suppliers and Adopters each have four Sub-Categories, crossed with the GICS industries, so every pairing of an industry and an AI role is its own basket: 544 in all, 470 of them populated in October. Membership is read from what companies, the press and analysts say about each name.
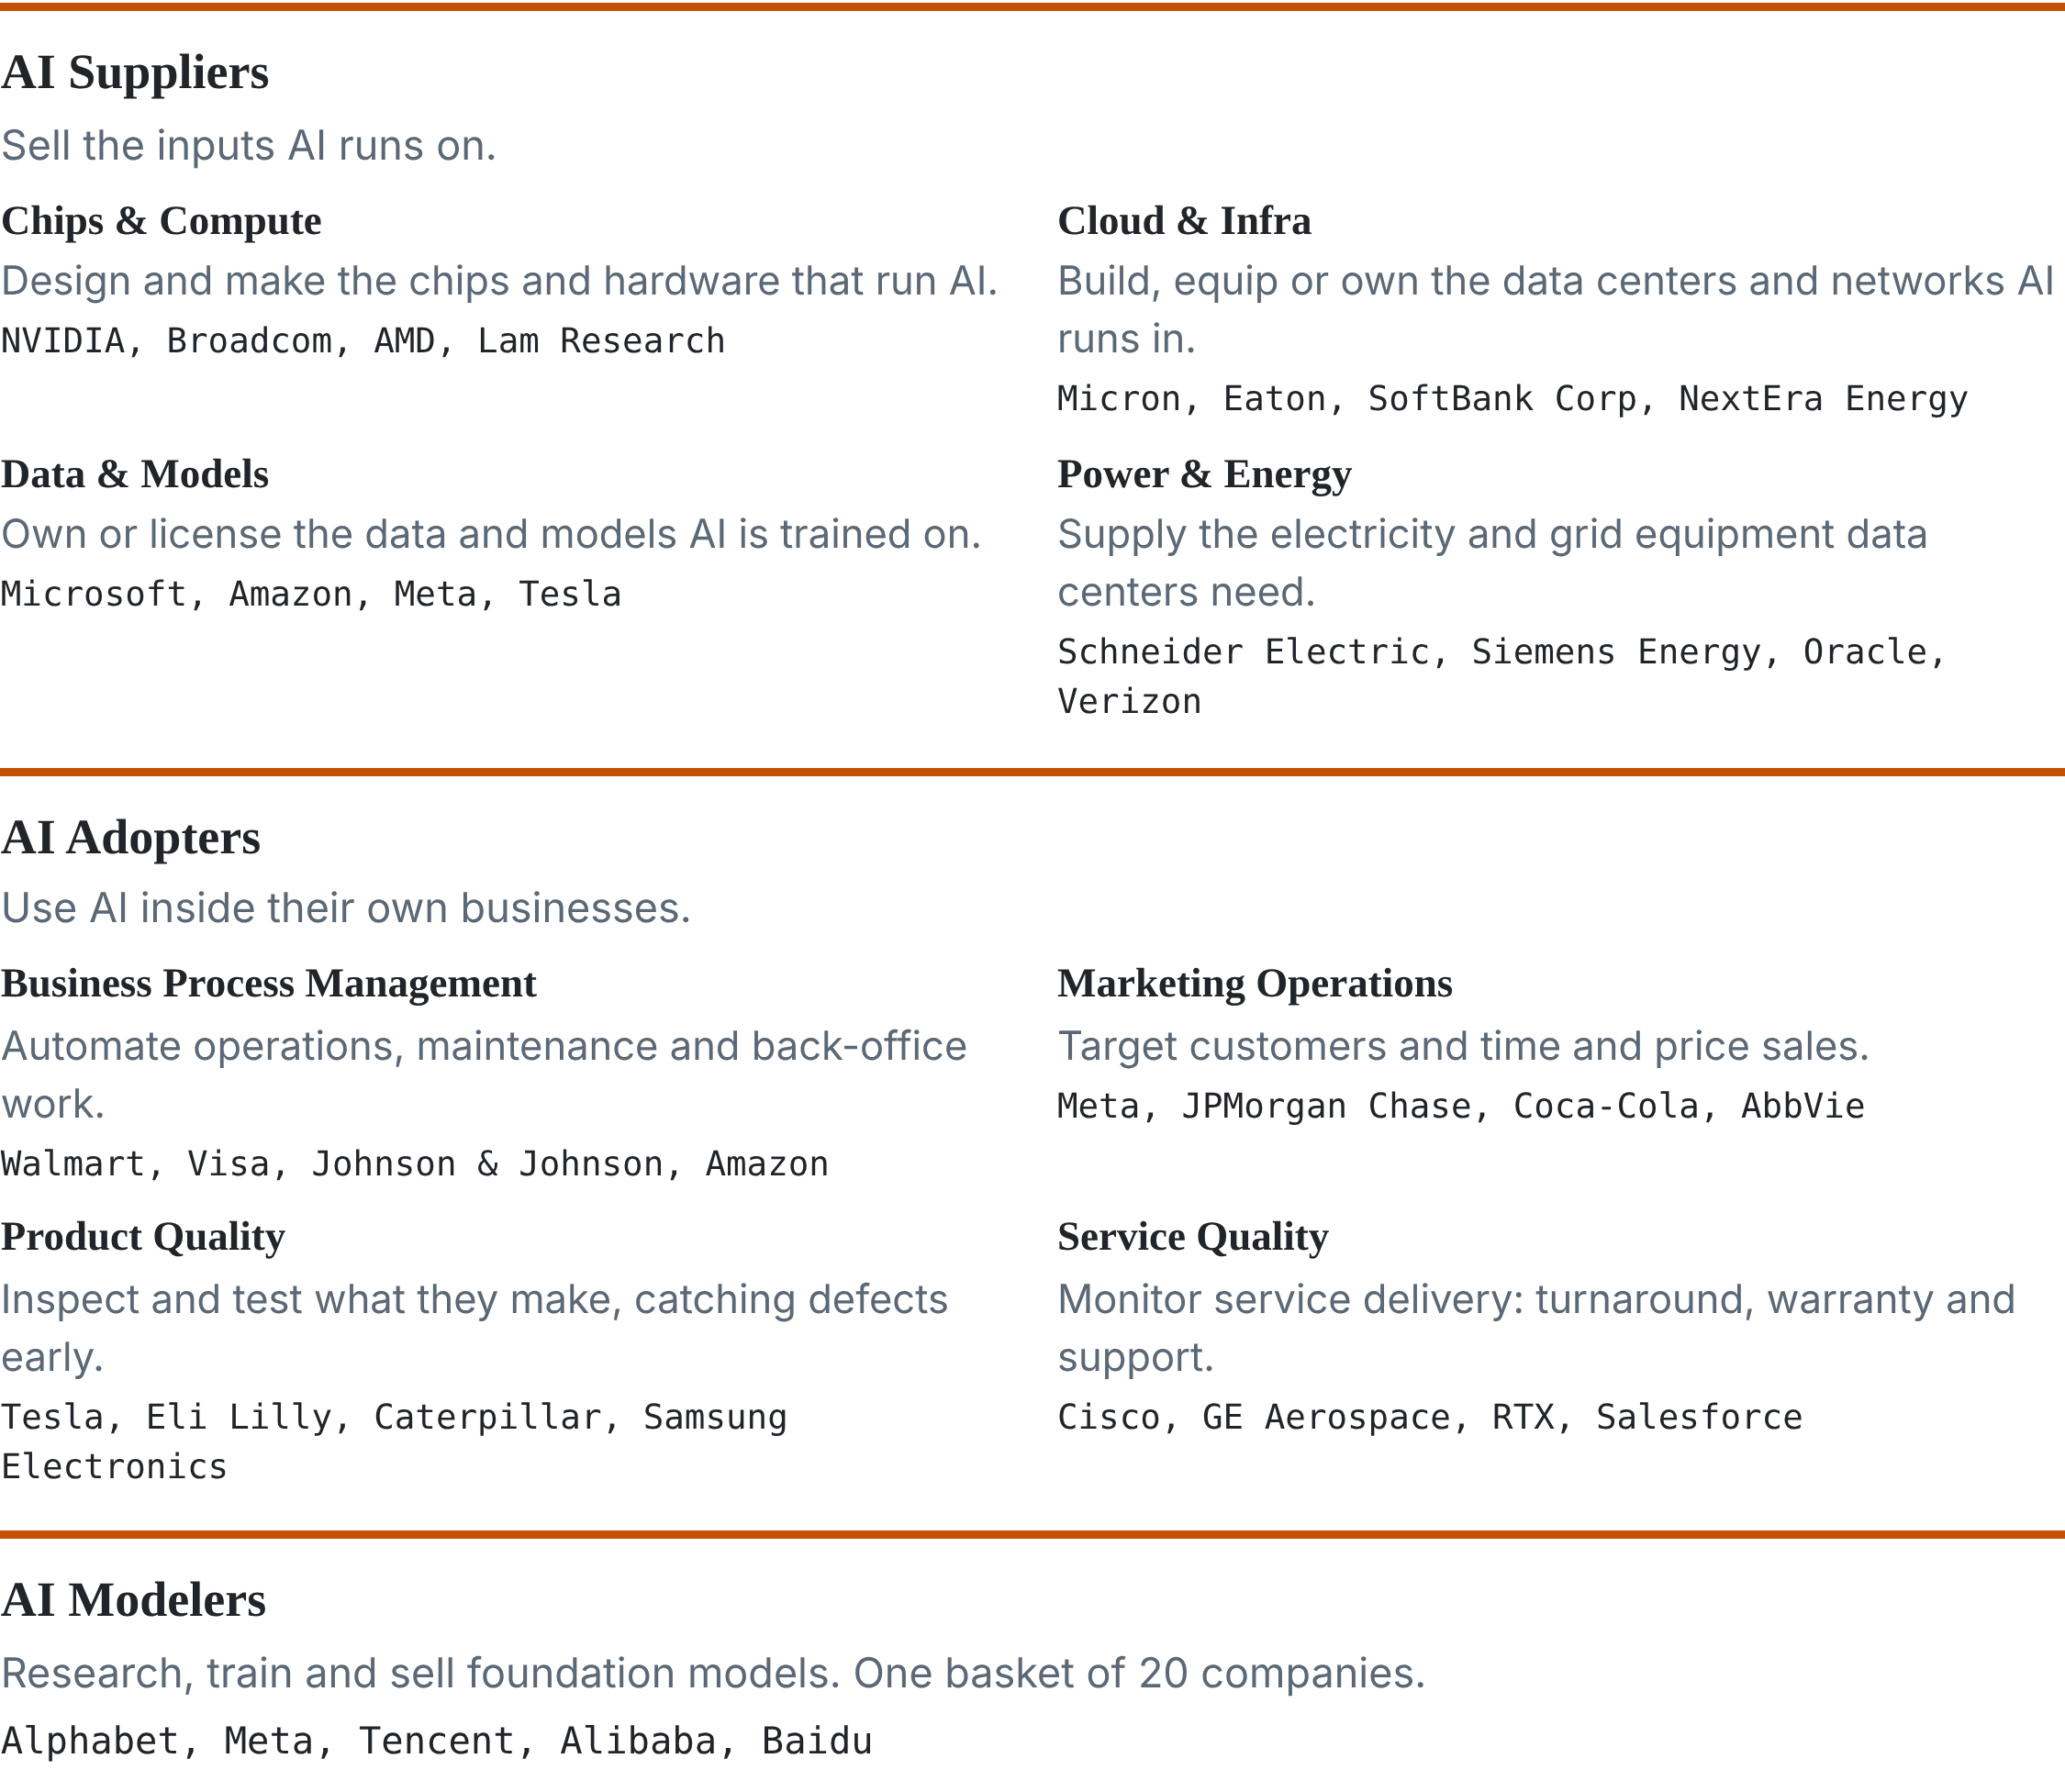
Builders down, users flat, modelers hit hardest
The gap between roles holds against either benchmark. Suppliers trailed the cap-weighted ACWI and matched the equal-weighted average of all covered stocks (−2.9%). Adopters beat that average by 3.5 points.
Modelers fell furthest. Pure exposure to the model layer, where profits depend most on the build-out continuing, was the most expensive place to be in October.
The industry view: technology at the center of the selloff
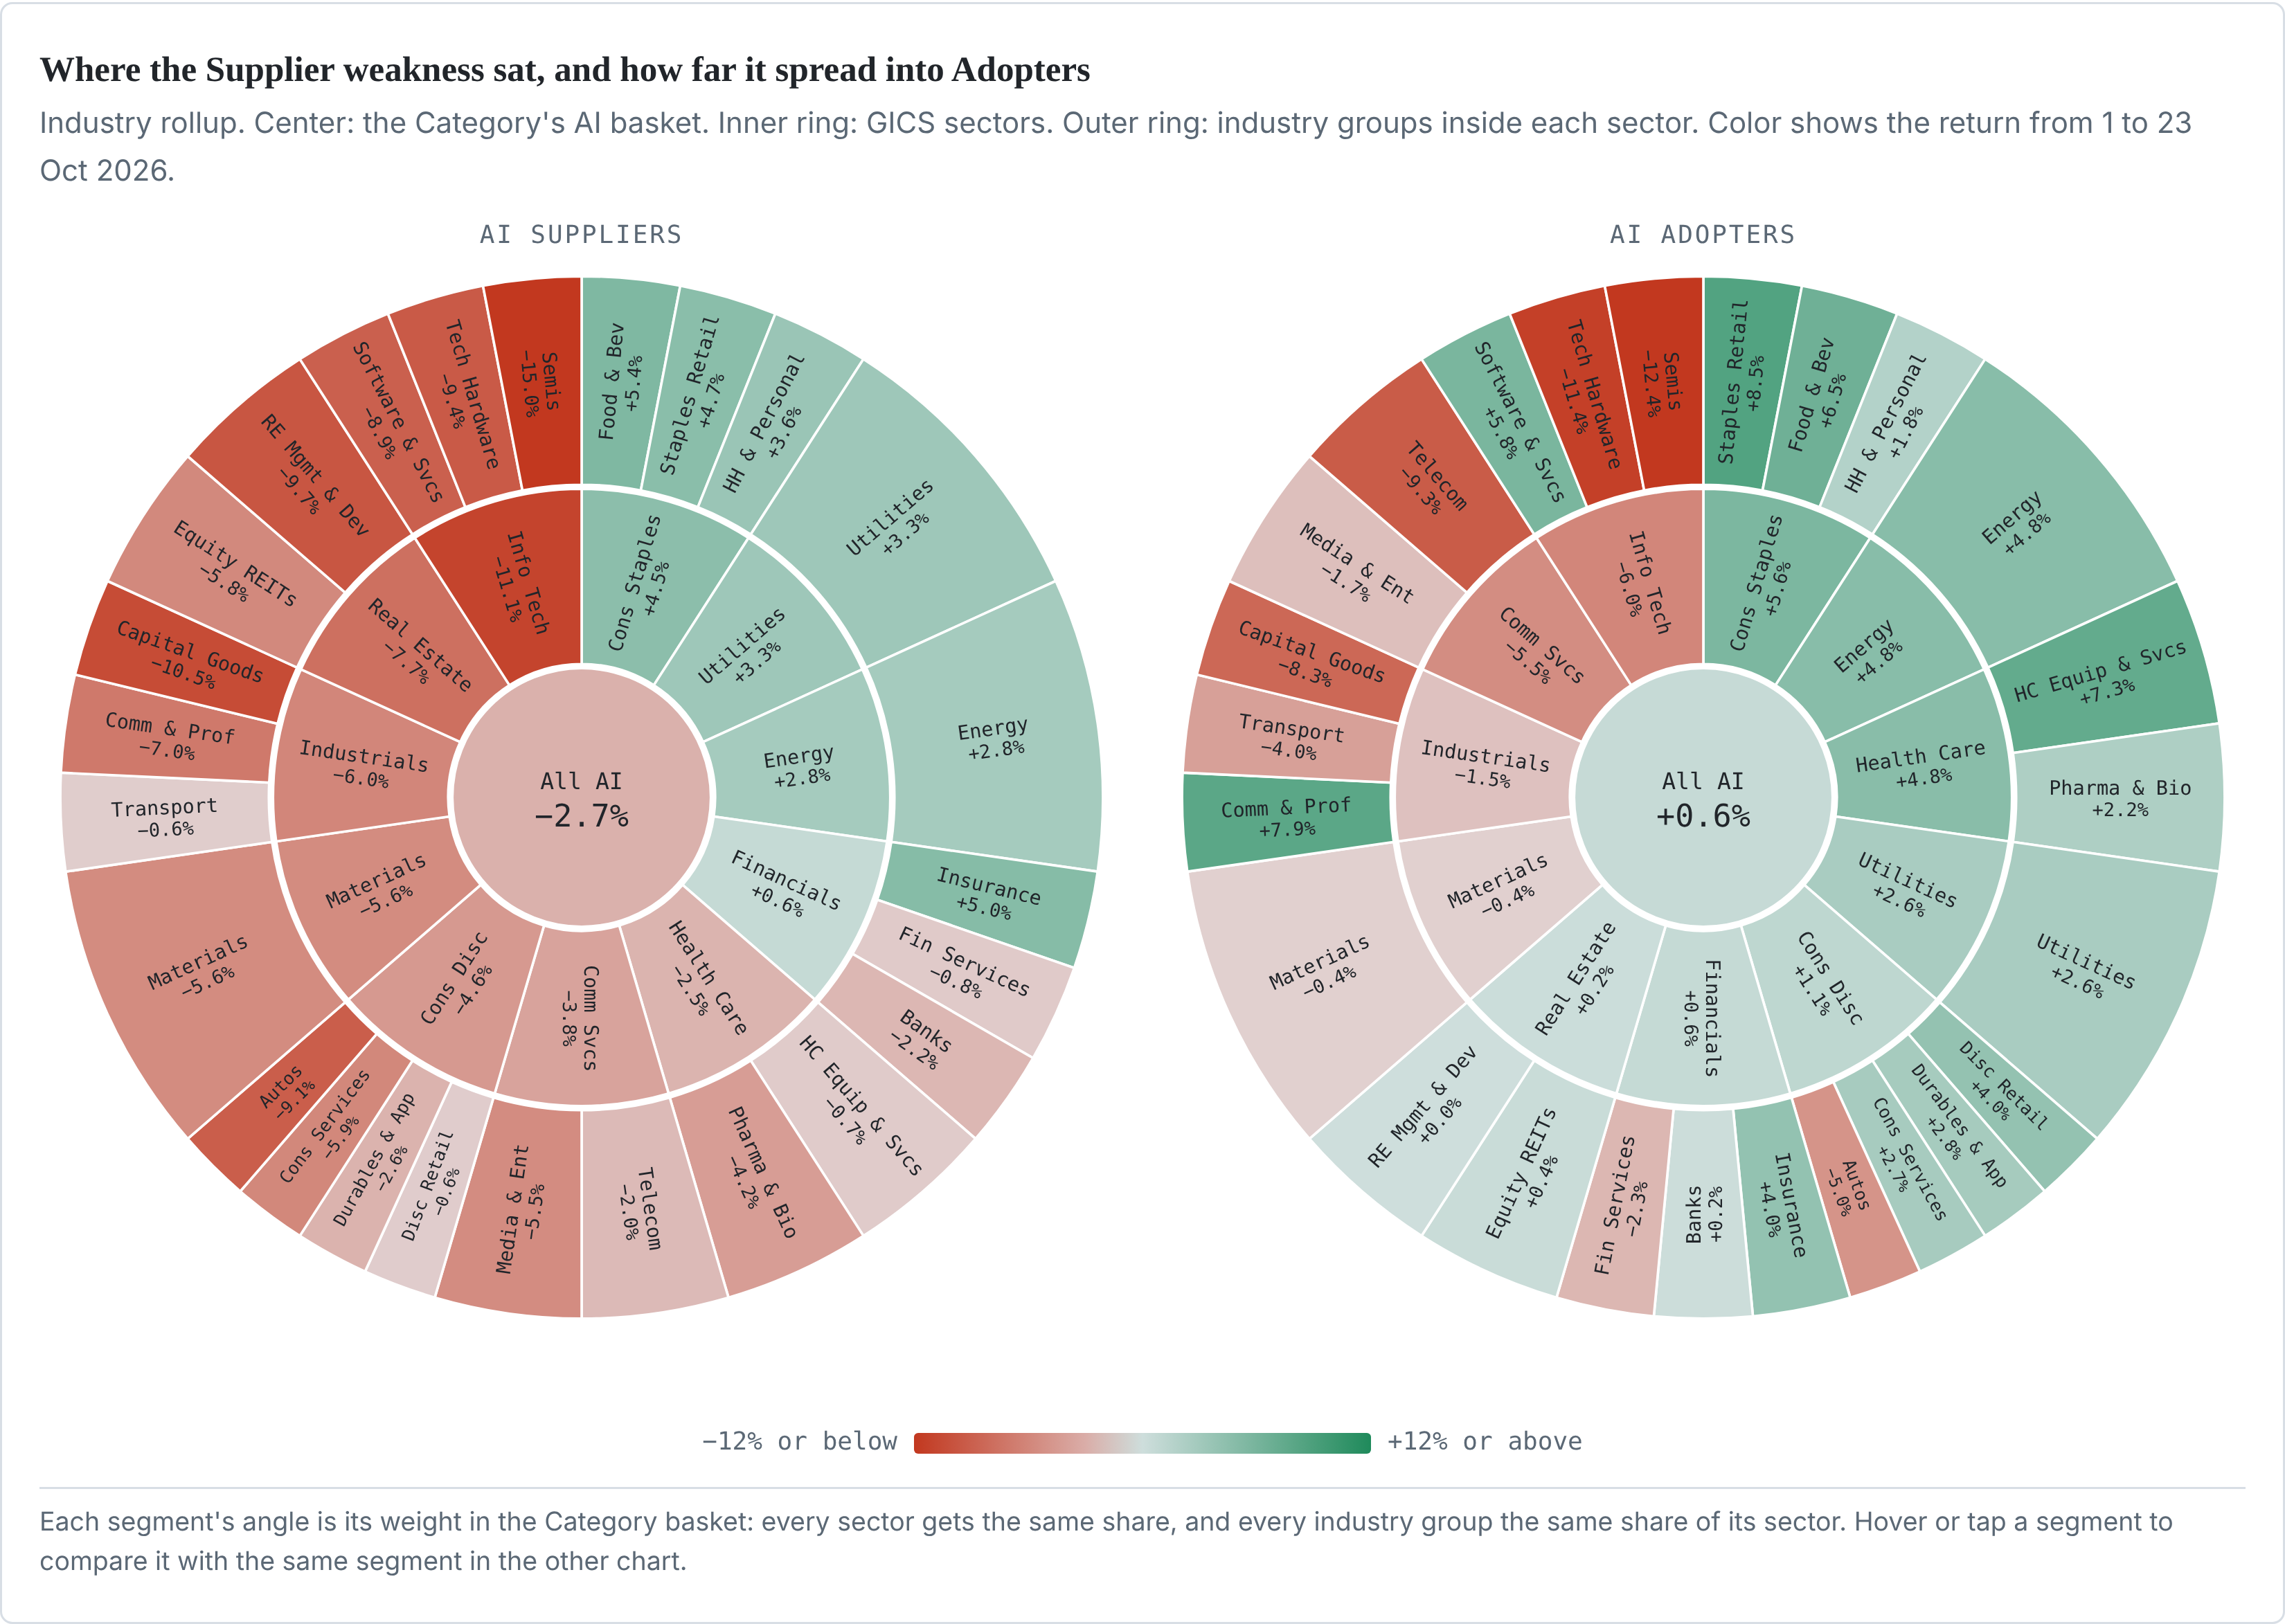
Supplier losses ran from technology into industrials and real estate. IT Suppliers fell −11.1% (semiconductors −15.0%), Capital Goods Suppliers −10.5% and real estate Suppliers, mostly data-center landlords, −7.7%.
The Adopter ring is mostly green: Health Care +4.8%, Consumer Staples +5.6%. Only IT (−6.0%) and Communication Services (−5.5%) lost more than 1.5%.
Capital Goods was red in both rings (−8.3% for Adopters) When both rings are red, the loss belongs to the industry; when only one is, it belongs to the AI role.
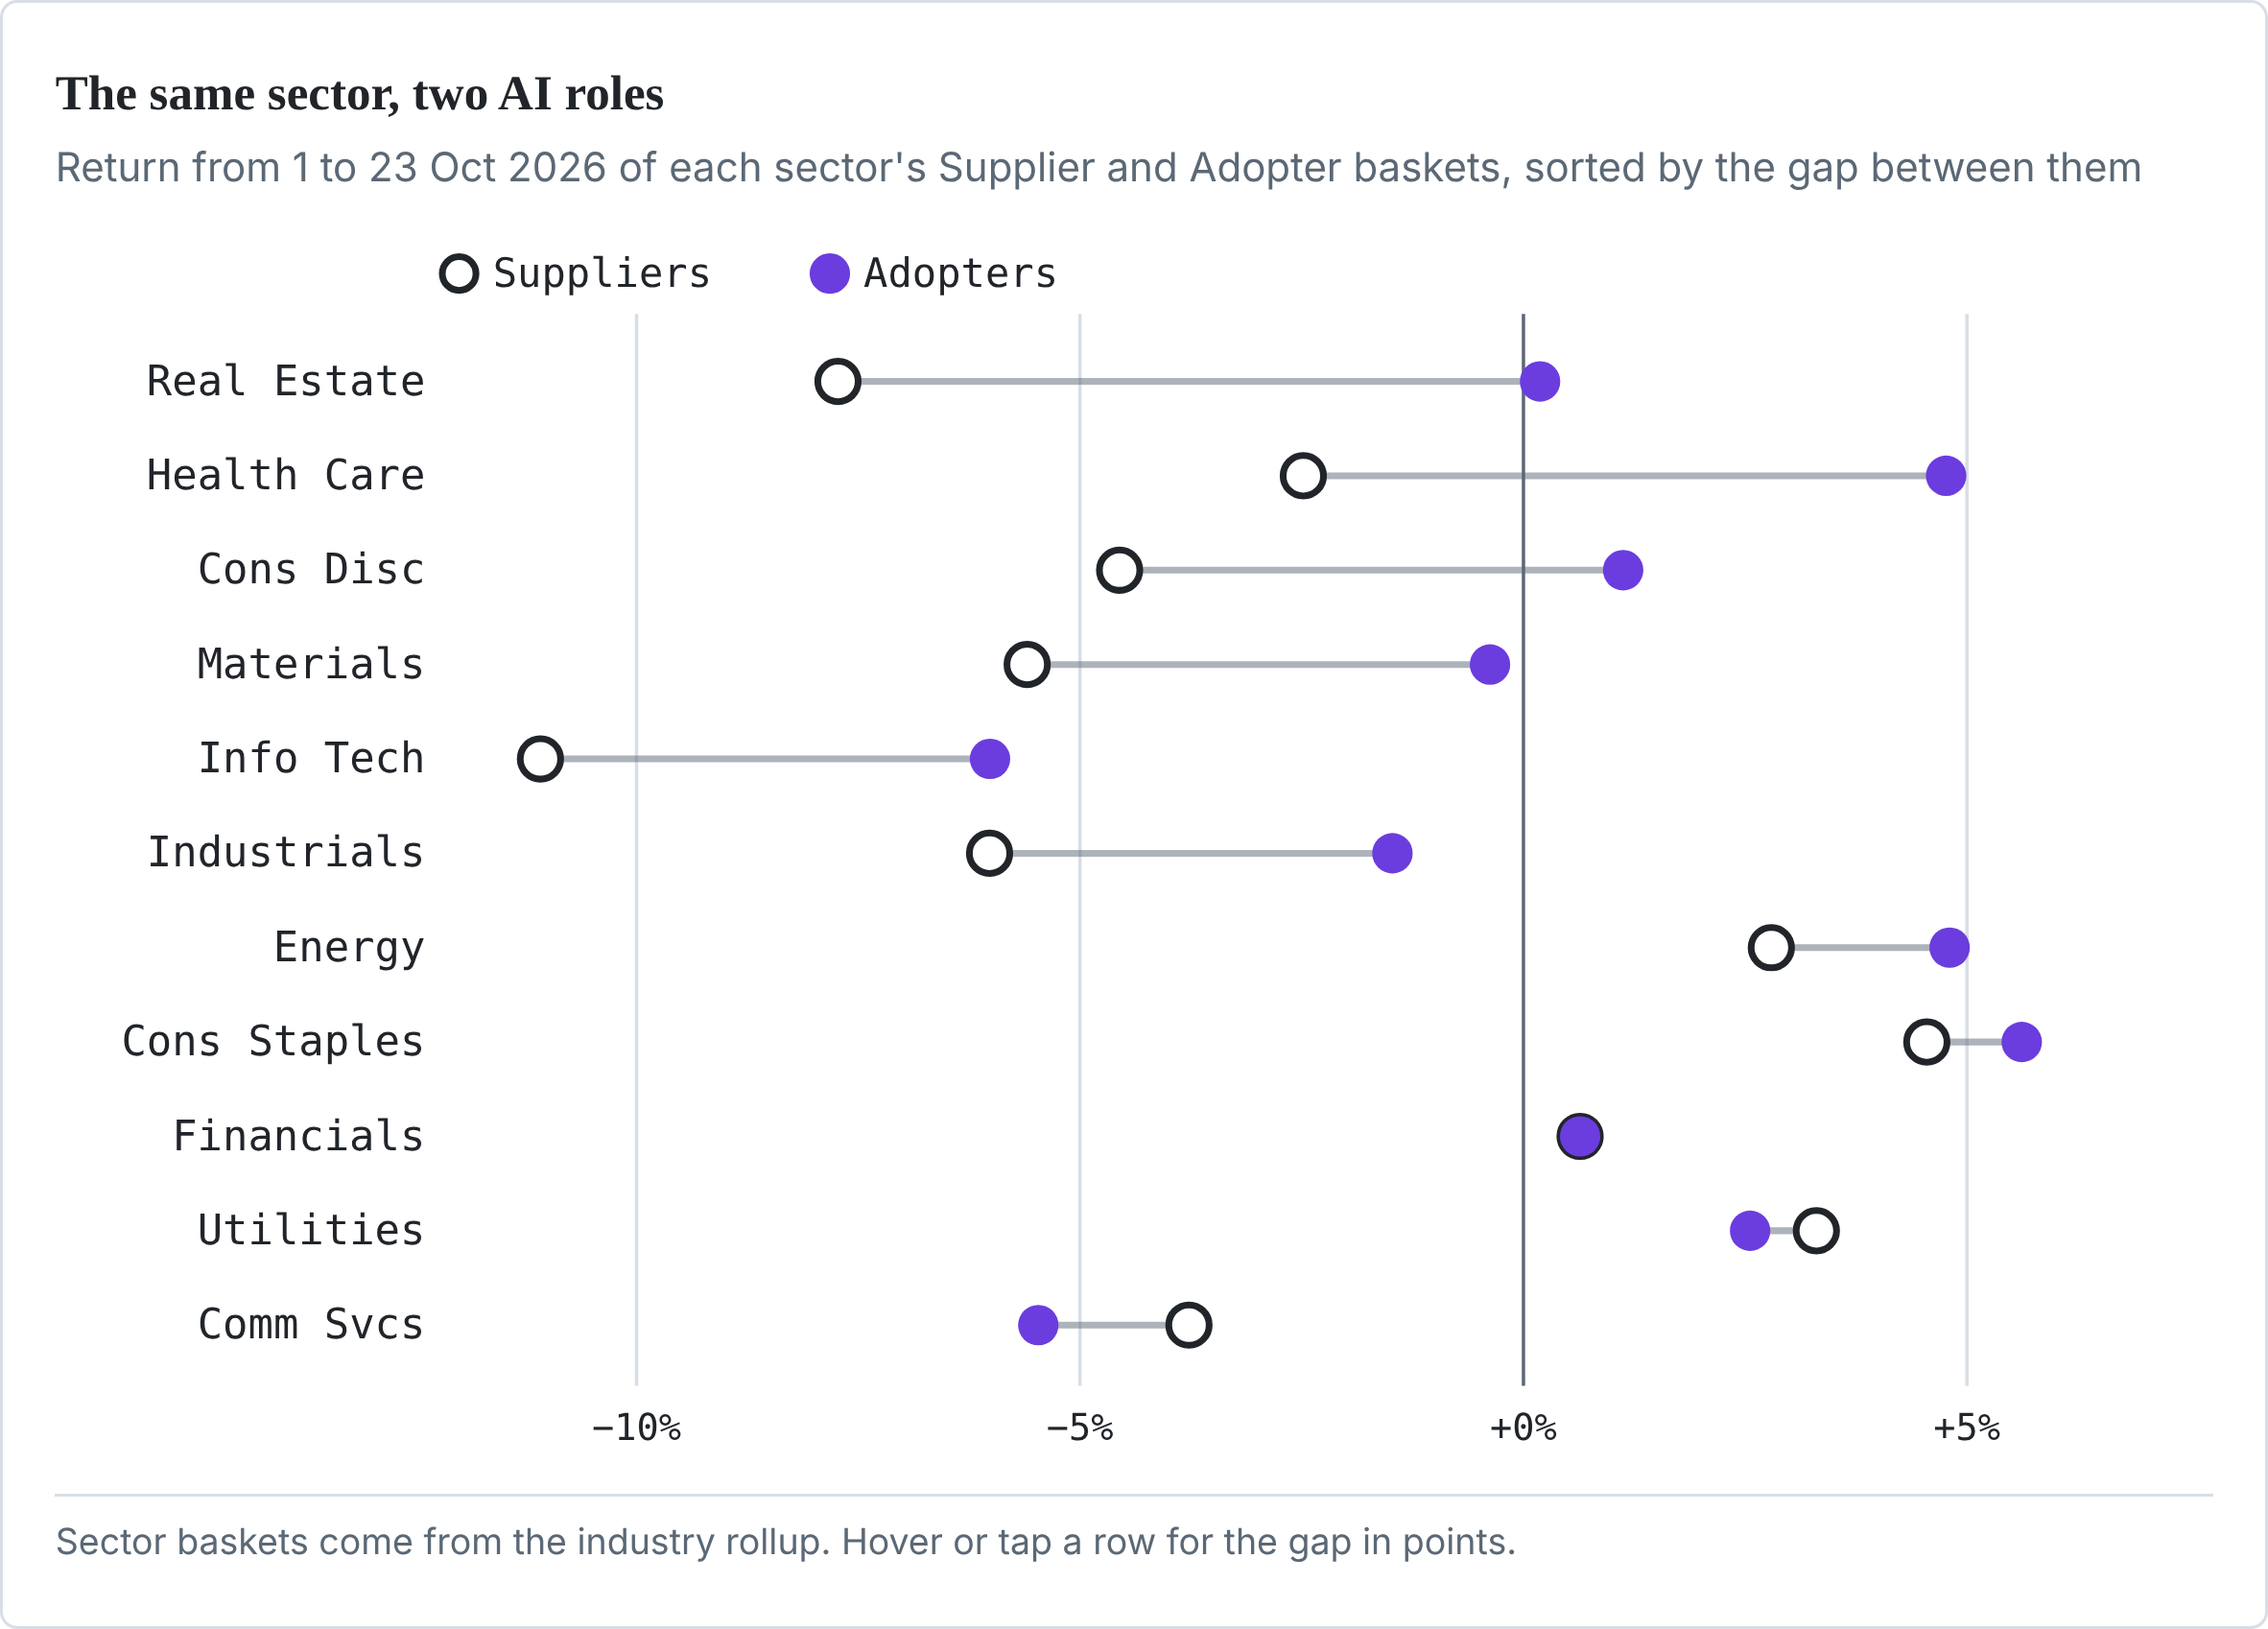
Setting the two rings side by side is where the taxonomy earns its keep. Adopters beat Suppliers in nine of eleven sectors, most widely in Real Estate, Health Care and Consumer Discretionary.
Inside IT, software and services Adopters gained +5.8% while Suppliers lost −8.9%. A sector or industry label alone would have put both groups in the same bucket. The AI label on a software name said nothing about its October; its role did.
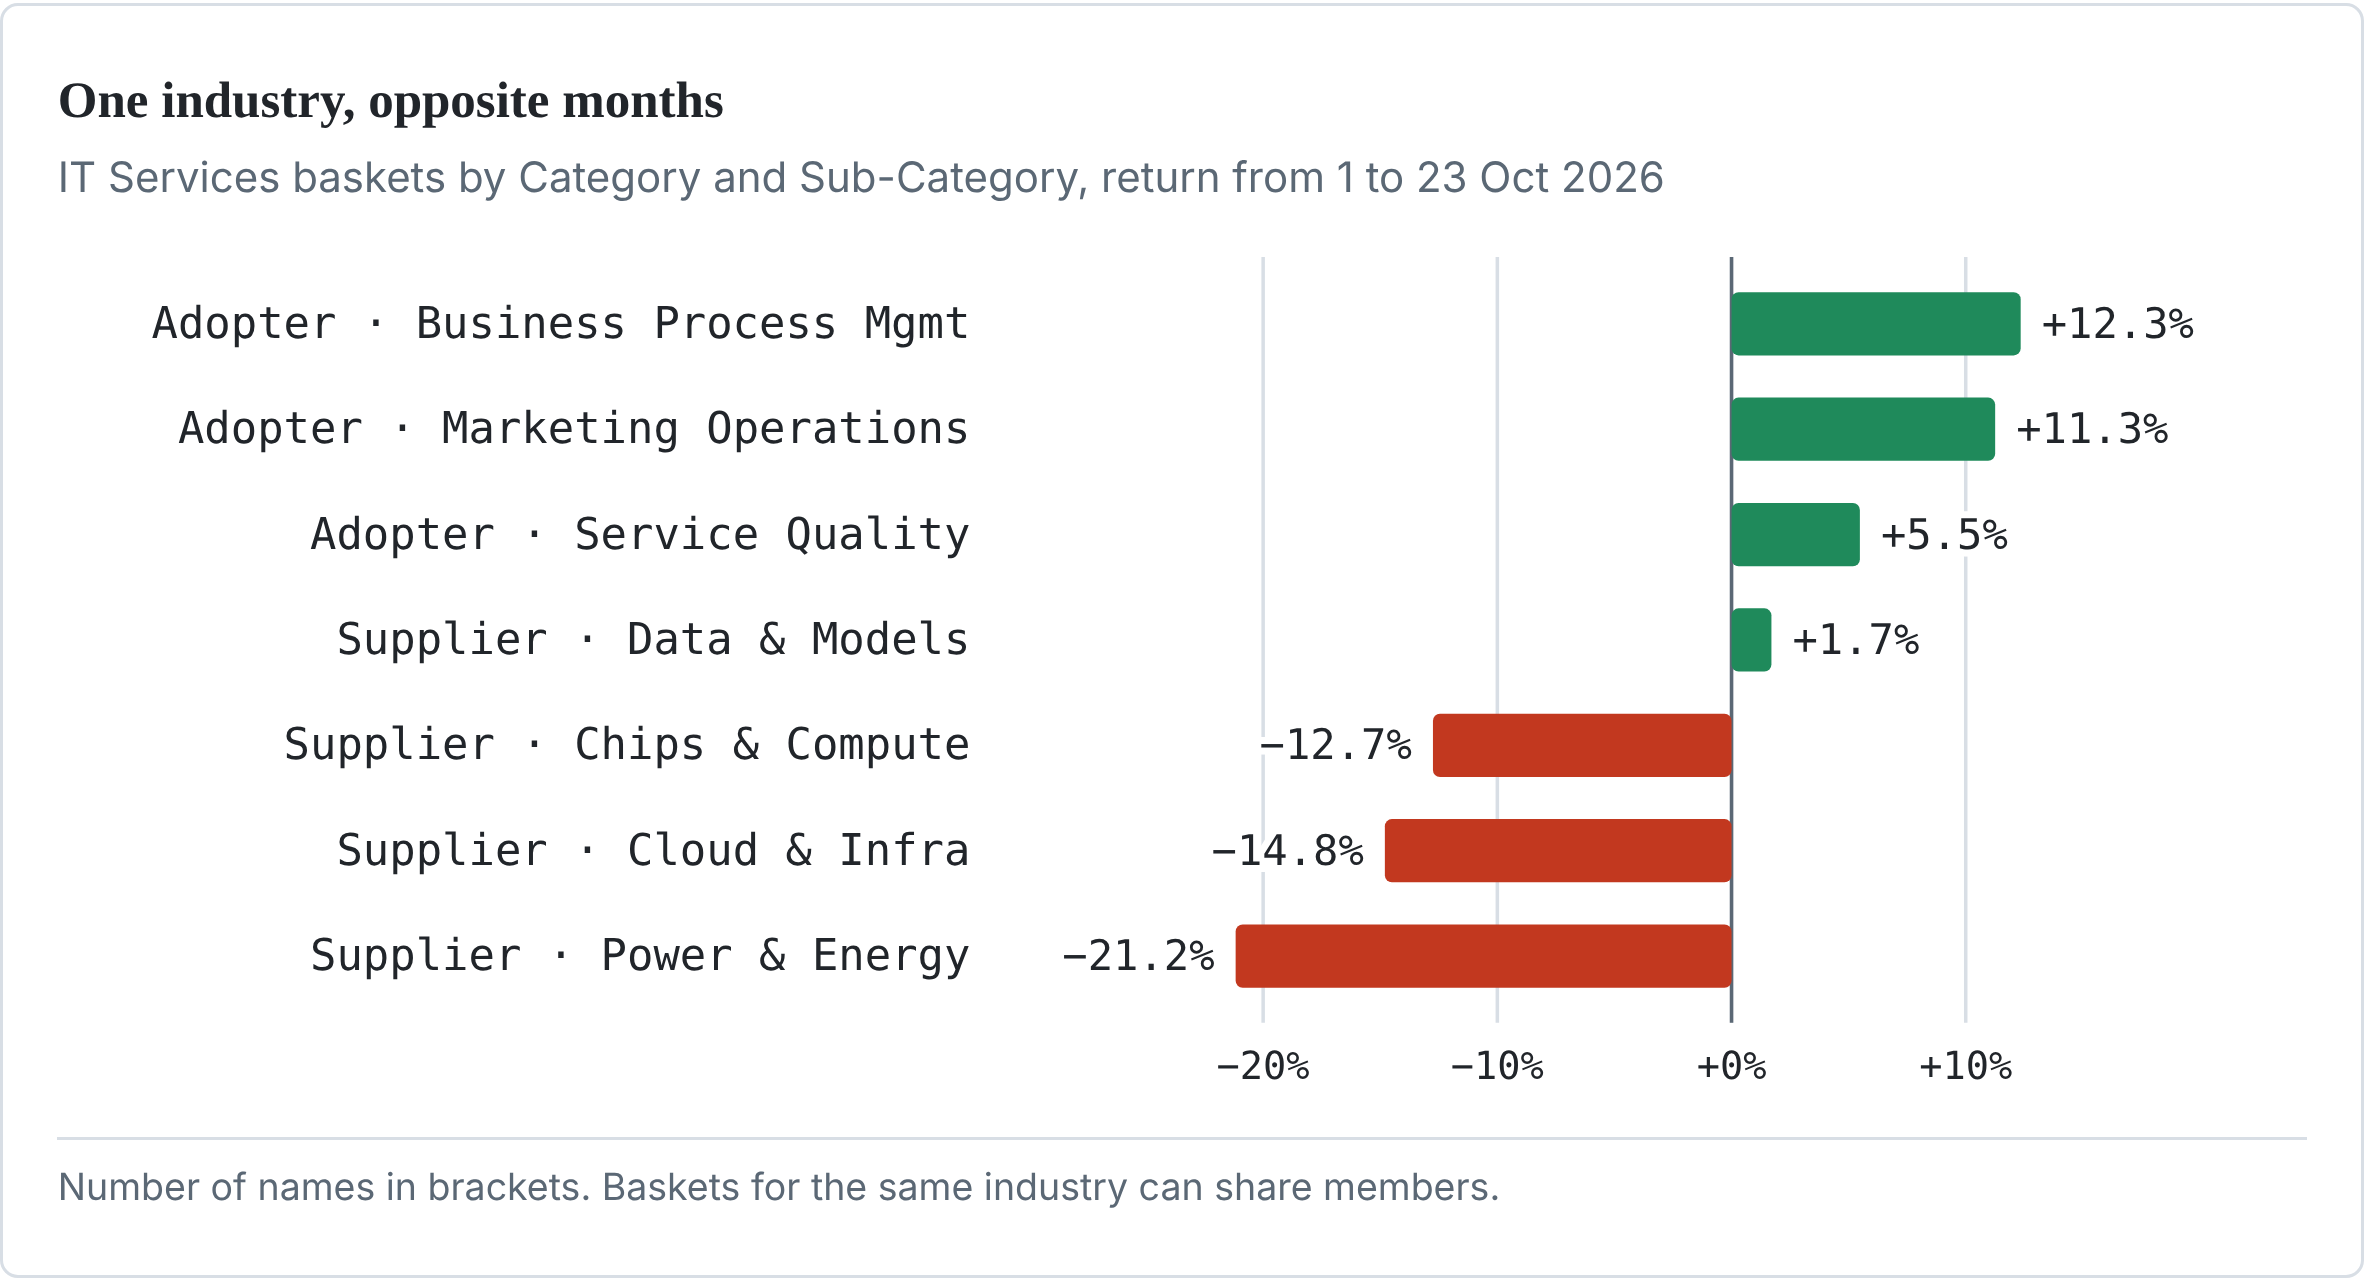
IT Services shows the split basket by basket: Adopter baskets rose 5.5% to 12.3%, and three of four Supplier baskets fell 12.7% to 21.2%.
The Sub-Category view: power and cloud, not data
The industry rings show where in the market the stress sat. A rollup by Sub-Category shows which link in the AI chain carried it.
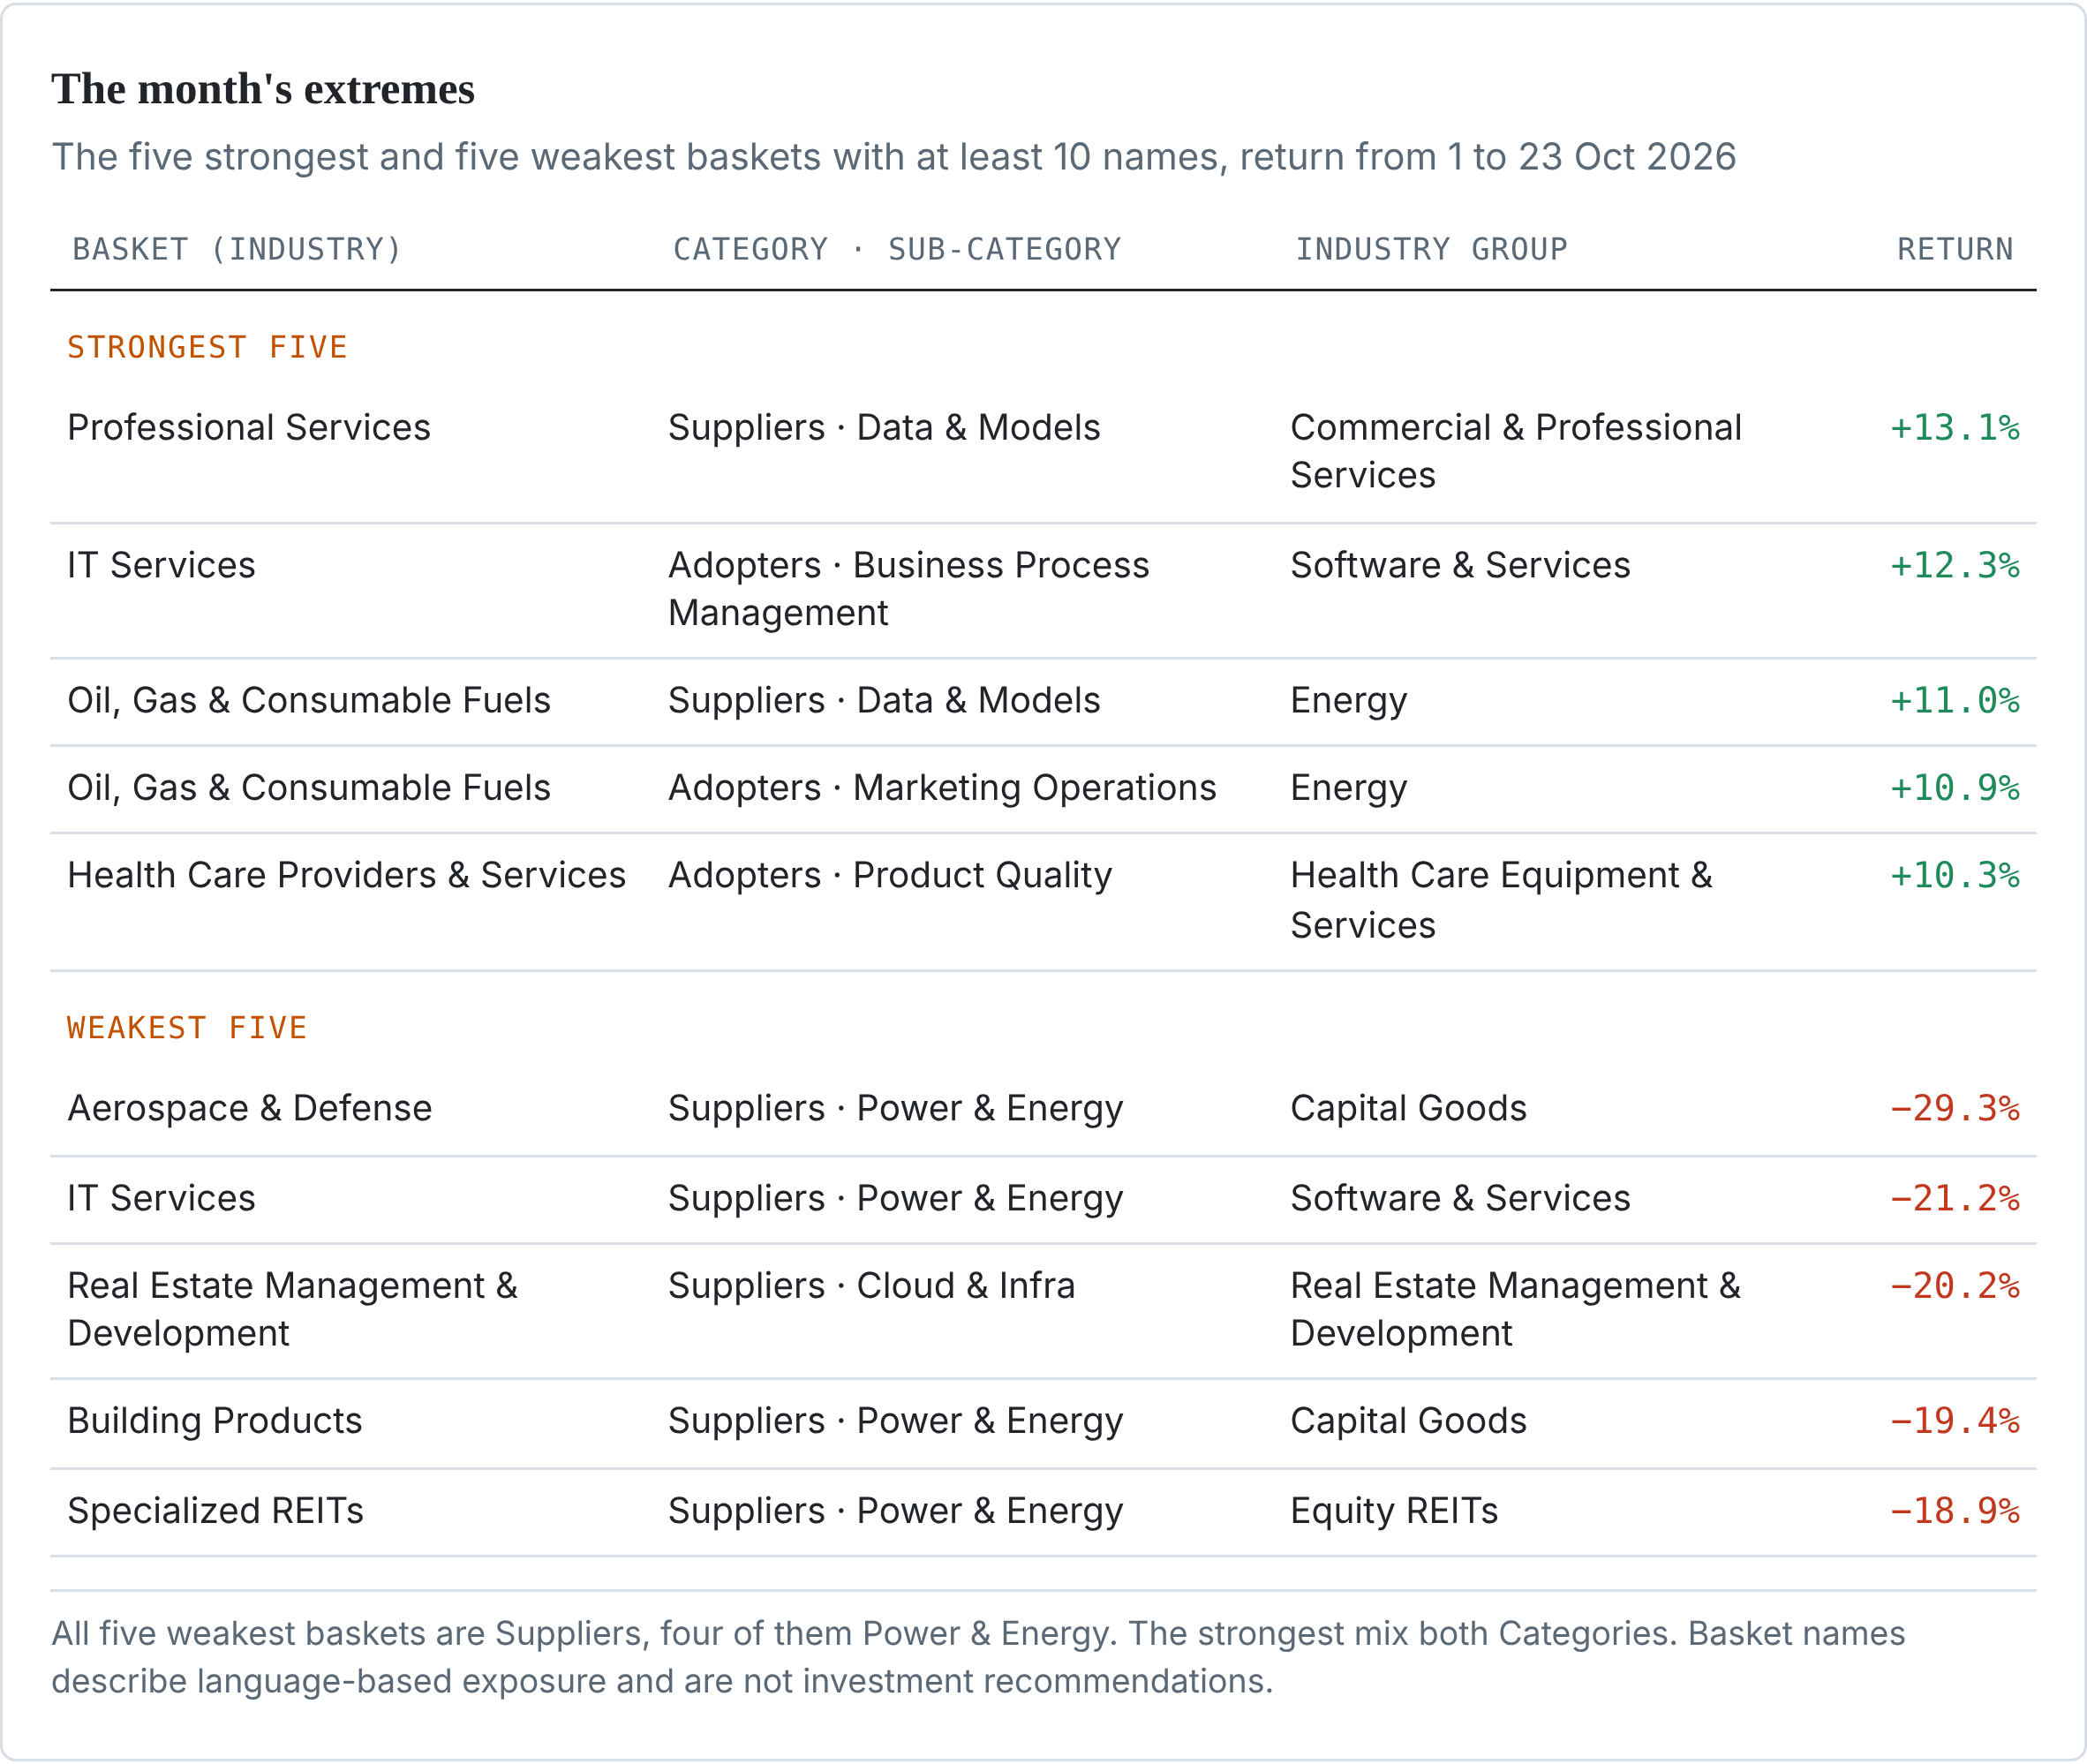
Among Supplier – Sub-Categories, Power & Energy fell −5.6%, Cloud & Infra −4.9% and Chips & Compute −4.2%; Data & Models was flat at −0.6%. Within Power & Energy, utilities rose +6.3%, while IT (−14.0%), data-center REITs (−18.9%) and industrial equipment makers (−9.4%) fell. The market sold the physical build-out and spared the companies that own data.
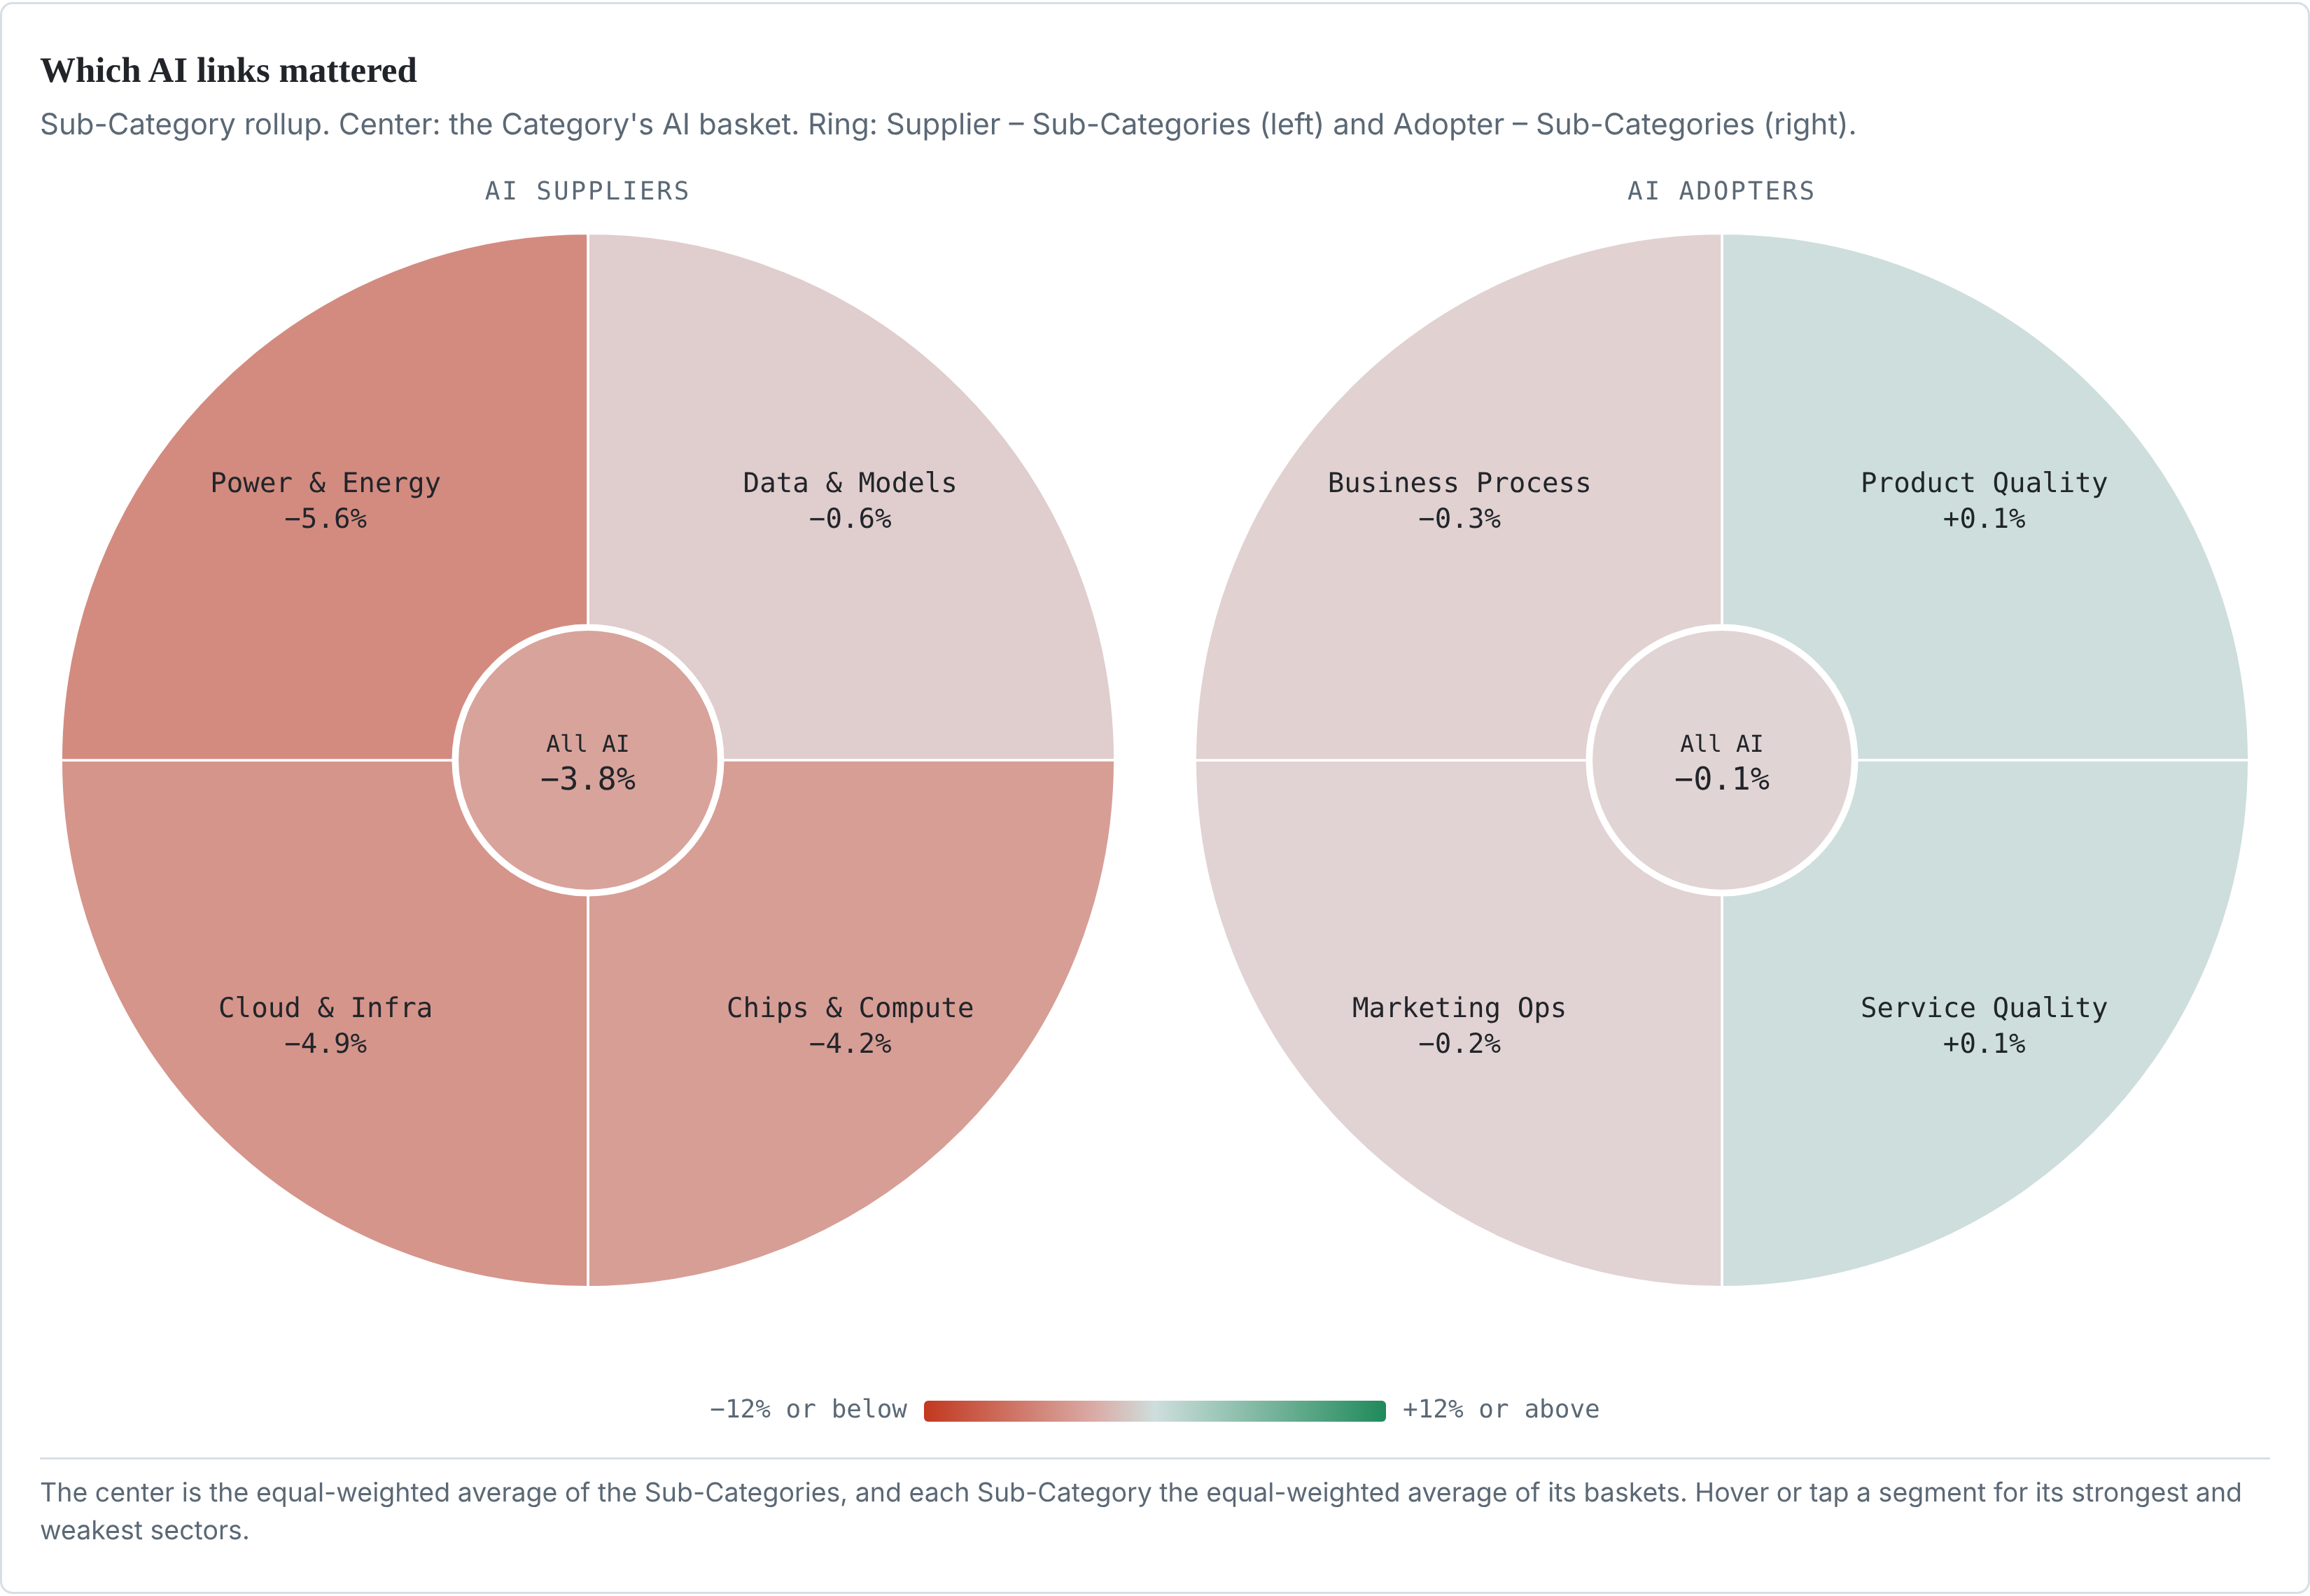
The four Adopter – Sub-Categories finished within 0.4 points of zero, against a 5.1-point spread across the Supplier – Sub-Categories. In all four, Health Care and Consumer Staples Adopters rose and Industrials and Communication Services Adopters fell. How a company used AI carried almost no information this month, which is itself a finding: Adopters moved with their industry instead.
"For suppliers, the kind of AI input a company sells decided the month. For adopters, the industry it works in did."
What this means for your book
Used together, the two views separate an AI position that is really a semiconductor-cycle bet from a bet on productivity gains in Health Care or Staples. Those moved in opposite directions this month.
- Attribution. Was your October AI loss an AI bet or a semiconductor-cycle bet? Mapping holdings to Category, Sub-Category and industry tells you.
- Hedging. A short in semiconductors or an AI ETF would not have hedged Adopter exposure, which rose. The right hedge depends on role.
- Risk. AI is several exposures, not one factor. A single AI factor understates the dispersion between roles, and crowding differs by role.
To run your own portfolio through the taxonomy, use Omega Point’s content sets or its MCP connector for Claude.
Methodology
How membership is decided. Each basket ("strategy") has a written investment objective, such as aerospace makers that use AI to inspect welds. Using Noonum's technology, Omega Point reads what companies, the press and analysts say about every stock and scores how closely that language matches each objective. A stock joins a basket when its language signal (its conviction score) for that basket is strong enough to qualify. Its weight in the basket is the strength of that signal (its linguistic beta).
- Baskets. The current version of the taxonomy has 544 baskets. Members are fixed as of 30 Sep 2026 in Omega Point's global equity universe.
- Basket return. The buy-and-hold total return of the members from 1 to 23 Oct 2026 (held without rebalancing), weighted by linguistic beta.
- Industry rollup. Baskets in the same GICS industry group are averaged with equal weights into an industry-group basket. Industry groups are averaged into sector baskets, and sectors into one AI basket per Category. GICS follows the 2023 structure; REIT industries roll up to Equity REITs.
- Sub-Category rollup. Baskets in the same Sub-Category are averaged with equal weights, and the Sub-Categories into one AI basket per Category.
- Separate Categories. Suppliers and Adopters are rolled up separately. AI Modelers form a single basket (20 companies, some listed more than once).
Robustness. The conclusions hold under three alternatives (industry rollup, Suppliers / Adopters): equal-weighting members inside each basket gives −2.0% / +0.4%; keeping one listing per company gives −3.0% / +0.5% (Modelers −17.0%); dropping baskets with fewer than 10 names gives −3.7% / +0.1%. Basket names describe language-based exposure and are not investment recommendations.